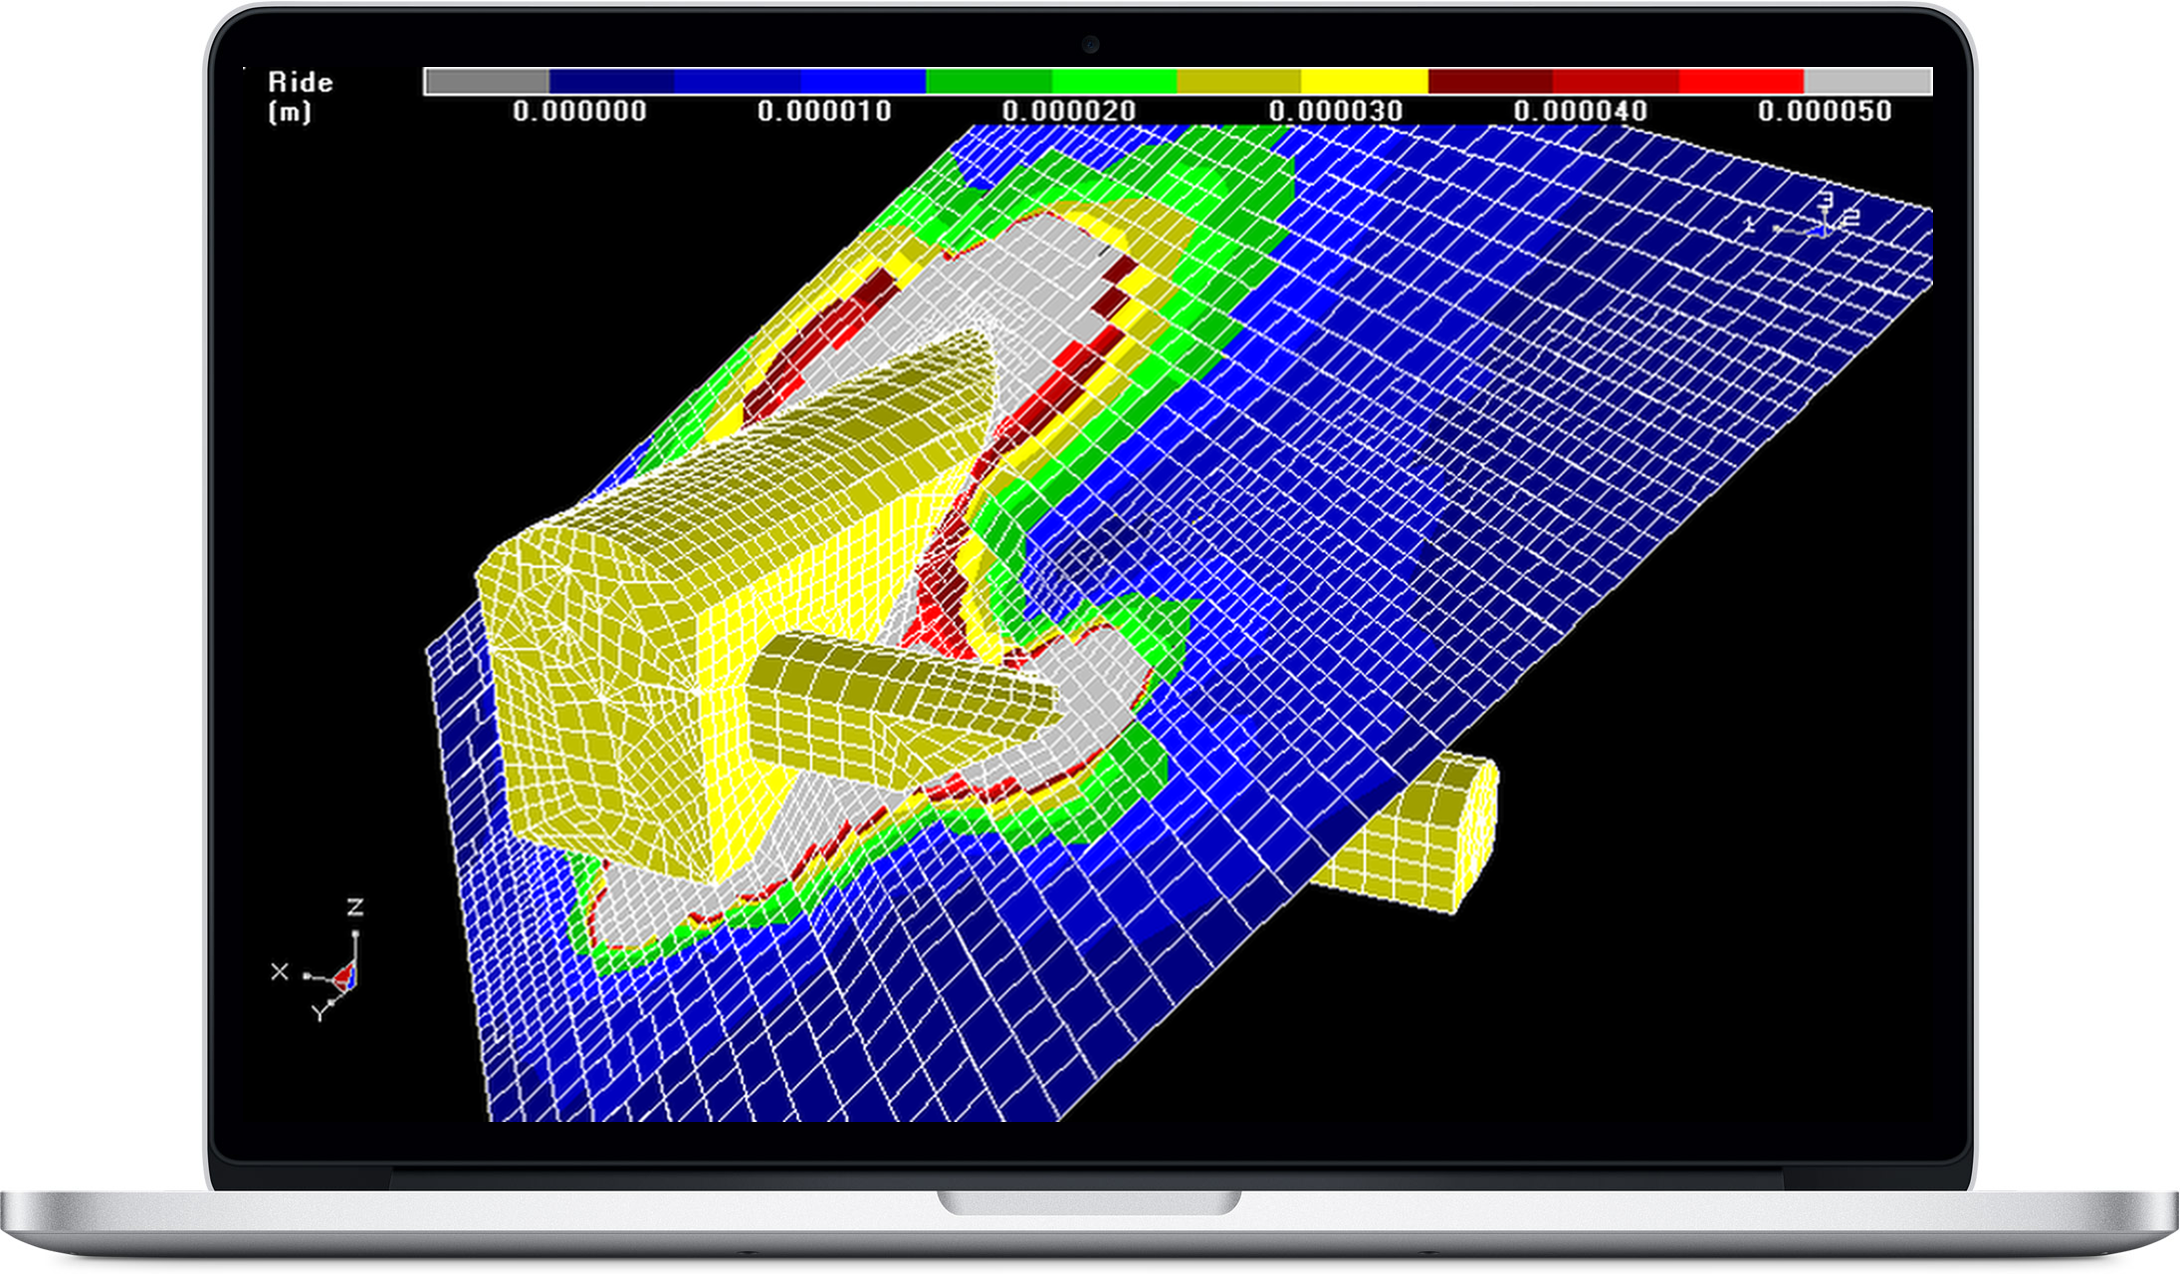
Map3D is a fully self-contained 3D stress analysis tool,
designed for fast, easy model building and visualization of 3D models:
- Self-contained 3D CAD system for model construction
- Video demo of FFLoop model building with "Snap > Win" option
- Video demo of DDLoop model building with "Snap > Win" option
- Video demo of Model Simplification Using Slicing
- Video demo of DDLoop Model Building Using Interior Loops example
- Embed Map3D models directly into PDF for interactive 3D viewing (3D PDF example requires Adobe Reader for 3D viewing)
- Advanced planar fault-slip (plastic) and 3D elasto-plastic boundary element (BEM) stress analysis
- 64 bit platform and parallel processing allows for practically unlimited problem size
- Damage tracking enables elastic models to track damage history of overstressed zones as mining advances
- Seismic event visualization with contoured display density.
Map3D is a fully self-contained 3D stress analysis tool, designed for fast, easy model building and visualization of 3D models
Built-in CAD Functionality
What sets Map3D apart from other analysis programs is its ability to accommodate a very wide range of problems in 3D. Large, complex, fully 3D problems can be built with ease using the built-in CAD functionality. Combined use of both FF and DD elements allows for simulations of 3D excavations with intersecting fractures or shear planes. The various versions of Map3D fully support plastic Fault-Slip and 3D rock-mass plasticity, featuring compatible input files for all versions thus providing a clear upgrade path as upgrades to advanced capabilities are required by the user.
Explore Our Map3D ExamplesWhy use Map3D
Integrated CAD
Powerful integrated CAD interface, no third-party software required. - Import/export facility for input data to other CAD programs.
Support & Training
Extensive training program for both program functionality and detailed engineering results interpretation.
Ease of Use
Easy manipulation of results for interpretation of rock mass failure, slip on fault planes, results on oriented bore holes and ubiquitous slip on bedding planes or joint sets.
Free Map3D Demo
Powerful pre-processing capabilities automatically fix most model construction problems. Overlapping and intersecting surfaces are accommodated by the program without user intervention. Model discretization can be optimized by setting a few control parameters to automatically concentrate elements at locations of interest. These capabilities greatly ease the burden of model building letting you get on with engineering rather than spending your time debugging models.
Download Demo
Events & Publications
| Date | Time | Event |
|---|---|---|
|
June 4th - 6th
|
9AM-5PM
(lunch included) |
June 2025 - Kalgoorlie, Australia.
Course Theme: The entire course will concentrate on hands on learning of model calibration, interpretation and application allowing participants to work through real examples in a combined lecture/tutorial style.
Course Details |
Trusted by engineers worldwide
I had a very successful experience with Map3D. It is extremely user friendly and easy to navigate. It is a very powerful tool that provided all the necessary functions to achieve my project goals. In the case, where I needed extra help or guidance, it was easy to get in contact with Terry who responded in a timely manner - most of the times within 24 hours. Terry is constantly engaging with his users by providing tailiored solutions to their needs. For example when I approached Terry with an issue I was having with data collection, he adapted the program to include an additional function that helped me collect data more efficiently. This kind of support is unique to the Map3D brand. I am very satisfied with the software and the support of the Map3D team.
What an amazing program. I found it to be extremely user friendly once I got the hang of it after a few days, it was a real pleasure to work with it. The User's Manual within the program was easy to follow and was a great source of information during my (dissertation) write-up. Thank you Dr Wiles.
Thanks for a wonderful course; I must say it is one of the best courses I have attended. So now I am full of ideas!
I have found Map3D to be a useful tool for handling small and large-scale 3D geomechanical analyses. The CAD interface for building and sequencing the models is straightforward, allowing new users to catch-on. In conjunction with experience, observations, and calibration, the program can provide meaningful results to assist with design decision making. The diligent technical support provided by Terry and his team is much appreciated.
I have used Map3D for the last 15 years and every time I had an issue with it was resolved within 24 hours. I would highly recommend using Map3D for numerical analysis purposes due to its ease in set and use, knowing support is available if required.
I have been using Map3D since the beginnings of this underground project. It has been the main tool for our analysis involving drift scale analysis, macrosequence analysis and seismic forecasting analysis. We like this tool because it is easy to learn and we can get good values to start working in engineering in short time. All of this makes Map3D an excellent tool for us..
Map3D as a mine-wide 3D stress modelling program in AGA. In the deep, narrow, tabular mining environment where we mine, the modelling program of choice must easily accommodate large mining areas and intricate 3D geometry in the model. 3D non-linear codes are in general not cost effective for this routine type if modelling considering complexity and runtimes. Map3D is easy to use and cost effective to model stress redistribution associated with mining in this environment. We also use Map3D to model the expected field stress associated with a mining geometry and use that as input into a 2D or even 3D non-linear model where it is impractical to set up a mine-wide model.
I have found Map3D to be a 3D numerical software that is user friendly and assists in the overall engineered solution. I have used this software on over fifty(50) mine operations throughout the world and should be part of your tool box. Technical support is immediate and helpful particularly when one is conducting studies that are unique and conceptual in nature.
Map3D is a powerful and versatile 3D boundary element programme. I have been using Map3D for approximately 20 years, analysing multi-seam bord-and-pillar, longwall, pillar extraction, and complex sub-level open stoping mine designs. The software has evolved much in this period and Terry has always listened to clients’ needs and developed Map3D to incorporate client requests through regular and meaningful software updates. Of particular note is the support that has been provided by Terry over the years. He has always personally attended to my enquiries and has responded promptly, and has shown dedication patience in supporting me to developing solutions.
The MAP3D training course was complete with important information. Not only did it demonstrate how to build a model, it also provided an understanding of the numerical modelling and all its input parameters. Apart from that, the technical support service have promptly answered any questions I sent through email at my workplace.
One of best geotechnical softwares in the world, I desire to use it in underground mining geotechnical designing and geotechnical analysis.
Yeah, I have been using Map3D since 2008 and I found it is a very powerful and flexible tool for stress modeling and model calibration: underground observations of ground response against stress redistribution. When I had questions about some features or special needs I asked directly to you and I found a very prompt and professional response.
Map3D has become the de facto standard for numerical modelling of mining layouts worldwide. The program is easy to use with Courses run frequently for all levels of user. The support is excellent with responses provided within 24 hours. Any bugs are thoroughly investigated and a fix provided in the subsequent update.
I have been a Map3D user since the mid-nineties and have used it routinely for the past 20-odd years of my career for improving my understanding of underground rock mechanics design issues. The code and user interface are simple to use and intuitive, having developed over many years of user interaction and continuous improvement. With Map3D, the response time to support-related queries is always swift and suggestions for code enhancements are welcomed and acted on.
From the earliest years of my association with Map3D I have been fortunate enough to know Terry Wiles personally and professionally and his ideas and teachings have inspired me in my pursuit of practical numerical solutions to mine design.
With Map3D program I can easy and fast construct and model underground rock excavations. The provided support is good because it is fast and I get answer to my enquiries and suggestions that helps me to improve and finish my model.
I have been a user of the Map3D software for many years. The software is friendly and easy to learn. The 64bit version dramatically improves the model run times. We use the results for long range planning at the mine and back analysis of underground observations. Dr. Terry Wiles is always available to help.