![]() Plot > Stress > τip In-Plane Shear Stress
Plot > Stress > τip In-Plane Shear Stress
![]() Plot > Stress > σip In-Plane Normal Stress
Plot > Stress > σip In-Plane Normal Stress
|
|
Top Previous Next |
|
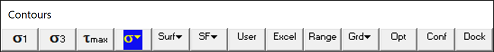
This allows you to contour the maximum shear stress These components can be accessed via the Stress Components toolbar as follows:
This toolbar can be changed to a vertical orientation by dragging is against either the right or left hand edge of the main window. It can be changed back to a horizontal orientation by dragging is against either the top or bottom edge of the main window.
Selecting the
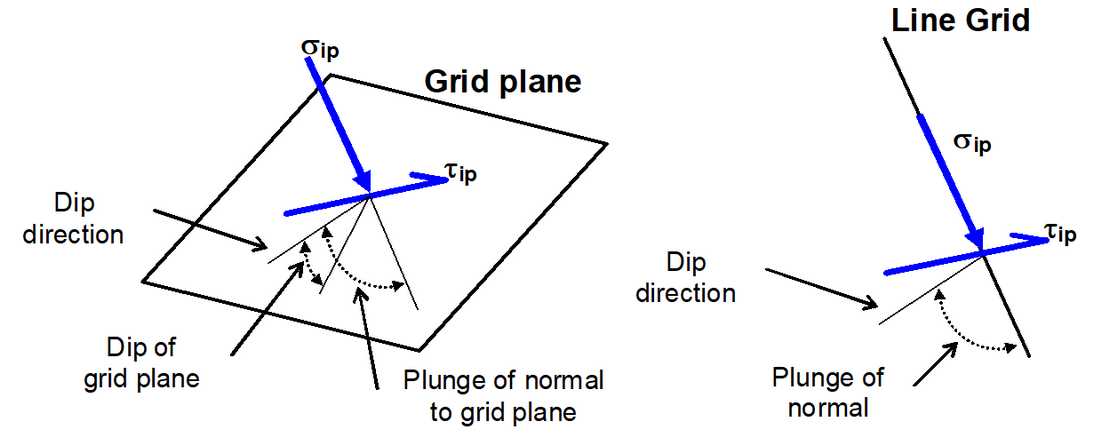
To calculate the in-plane stresses, the stress state at each point on the grid plane is reoriented to determine the maximum shear stress parallel to the grid plane and the stress normal to the plane. Note that σip is oriented normal to the grid plane and parallel to the direction of a line grid.
•dip direction is measured positive clockwise from the y-axis. •dip of the plane is measured positive down from the horizontal (i.e. the dip direction). •plunge of the normal is measured positive down (i.e. negative up) from the horizontal.
In elastic analysis, the maximum in-plane shear stress is normally used with the in-plane normal stress and the Mohr-Coulomb strength criterion
to estimate the amount of slip due to over-stressing, on a fault, joint set or bedding plane oriented in the same way as the grid plane. Since these parameters are orientation dependant, this criterion is representative for anisotropic rock mass stability.
By contrast, in non-linear analysis the stresses can never exceed the strength unless some creep is used. In this latter case, viscous creep can allow stress states above the failure criterion, thus indicating a lack of static equilibrium. Hence for non-linear analysis one normally directly considers the amount of non-linear strain or the strain rate predicted by the model
Backfill-Hyperbolic in DD planes.
Over-stressing can be presented in several forms including:
The contour range is set using
Any of these components can be added to the contouring toolbar if desired
The user may find it handy to add the
button to the contouring toolbar for quick access to all stress components.
Related topics:
|